
What 4 Frontier Models Cost to Finish the Same Task
We ran one identical web research task 30 times across Grok 4.6, GPT-5.6 Sol, Claude Opus 5 and Claude Fable 5, and measured what each one cost to finish it. Every price gap between the models came in smaller than the rate card predicted.
We ran one web research task 30 times across 4 frontier models and measured what each one cost to finish it.
The task was the same for every model, down to the byte. Find 10 companies that announced a funding round of USD 100 million or more inside a fixed 1 month window. Return strict JSON. Do not answer from memory. Every model got web search and page reads through DeepAPI at the same price, in the same agent harness, through the same gateway.
29 of the 30 runs finished. 288 of the 300 cited sources resolved to a page naming the company. Total spend to produce these numbers was $30.25.
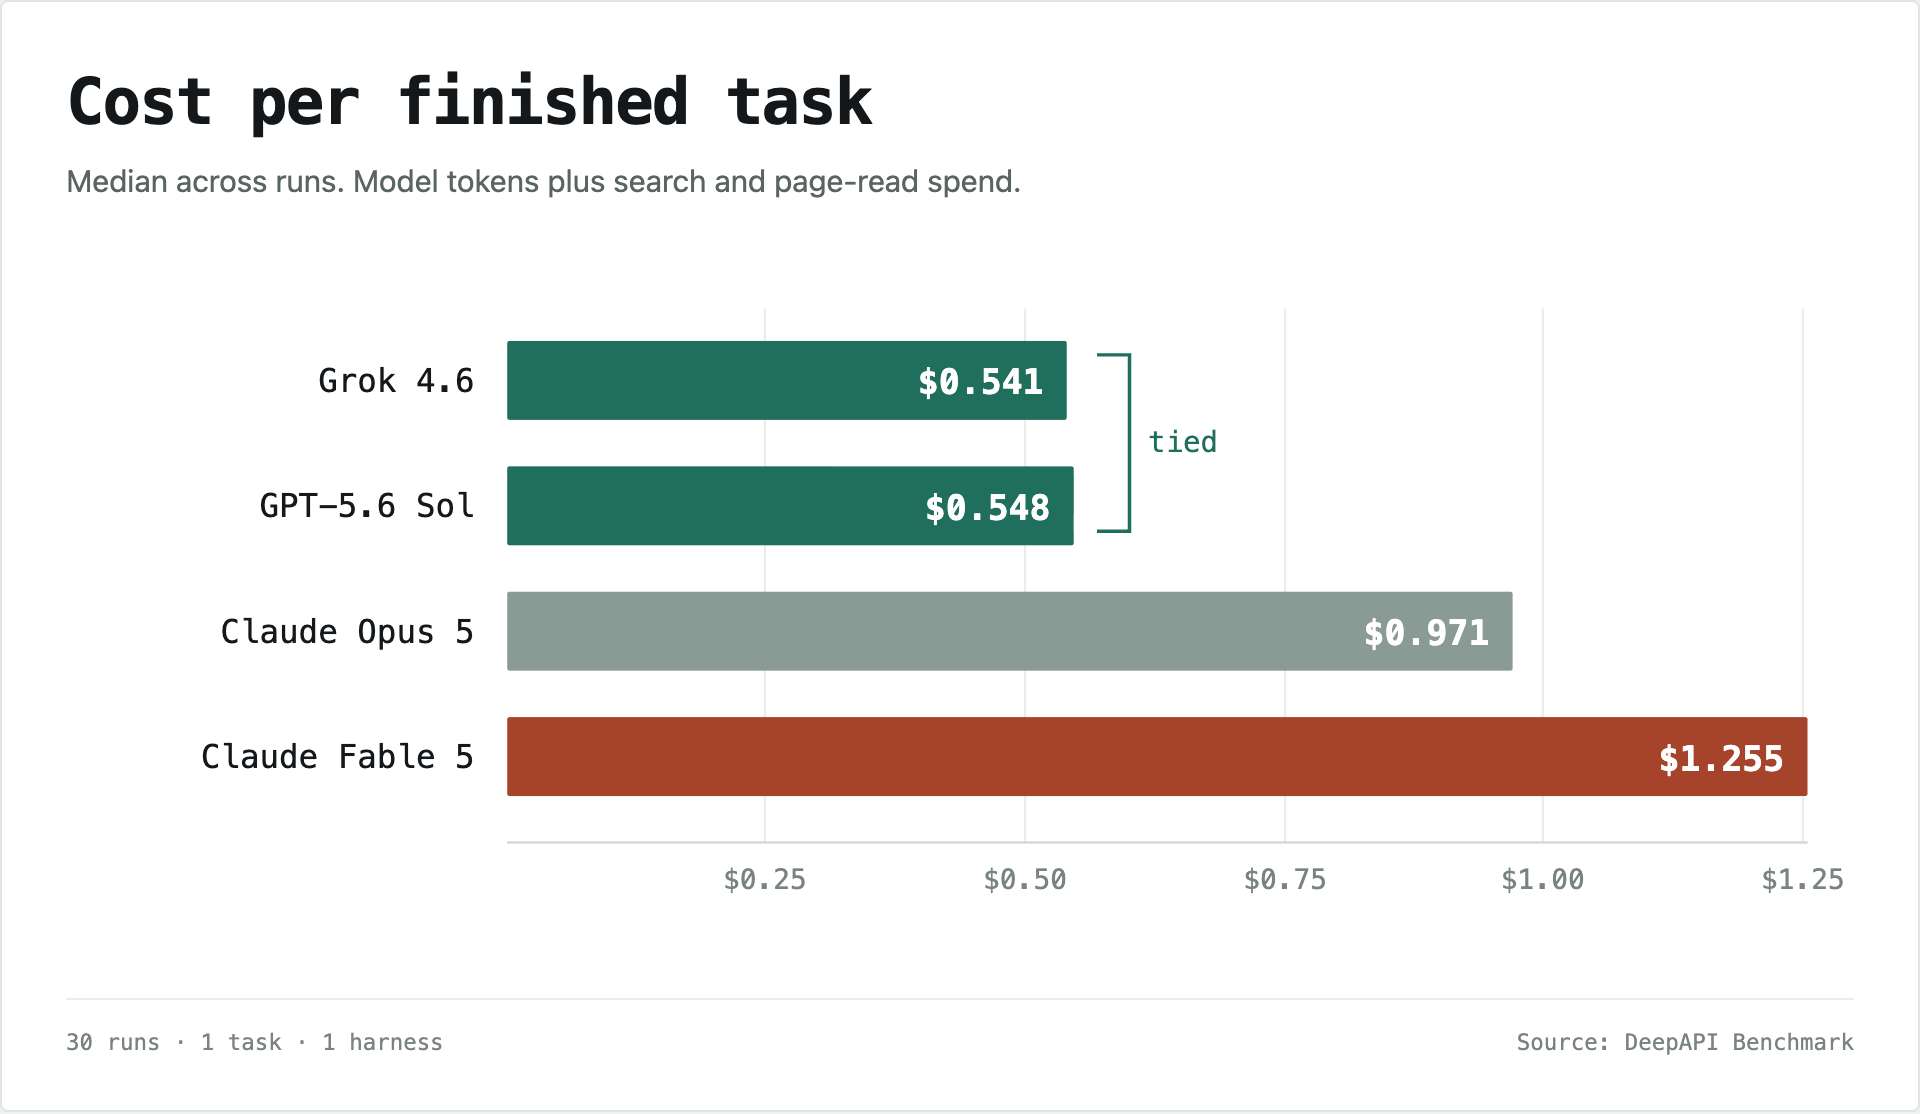
Here is what the same finished task cost.
| Model | Model spend | Retrieval spend | Total | vs best | Rate card in / out |
|---|---|---|---|---|---|
| Grok 4.6 | $0.406 | $0.134 | $0.541 | 1.00x | $2 / $6 |
| GPT-5.6 Sol | $0.423 | $0.125 | $0.548 | 1.01x | $5 / $30 |
| Claude Opus 5 | $0.856 | $0.105 | $0.971 | 1.80x | $5 / $25 |
| Claude Fable 5 | $1.175 | $0.080 | $1.255 | 2.32x | $10 / $50 |
Grok 4.6 and GPT-5.6 Sol finished the task for the same money. Their rate cards are 2.5x apart on input and 5x apart on output. The 1.3% gap between their bills is smaller than the variation between 2 runs of either model, so read them as tied.
Retrieval sat between $0.08 and $0.13 for all 4 models. It is 15% of the bill at the top of the table and 6% at the bottom. The ranking is decided by model tokens.
How we ran it
The design was written down and frozen before any paid run, including the rule for the claim we were testing. Amendments were appended afterwards rather than edited in.
- 1 harness, 1 gateway. All 4 models ran in the same agent harness with identical flags, reached through the same gateway. No arm had a different provider path.
- 1 prompt, 18 lines. Task, the exact search call, and the output schema. No skill files, no per-model tuning, nothing suggesting how much to search or how long to work.
- No search budget. How much each model spent is the thing being measured, so it was never capped or allocated. Each page read was capped to a single page, so retrieval measured page reads rather than site crawls.
- Mechanical grading, no judge. A script checked the schema, the count of 10, the amount threshold, the date window, and that at least 8 of 10 cited URLs returned HTTP 200 and contained the company name.
That last check carries the design. Without it, the cheapest way to win is to answer from memory, run zero searches, and skip the task. With it, a model that skips retrieval emits URLs that do not resolve, and the run is recorded as not done.
The rate card is a poor predictor
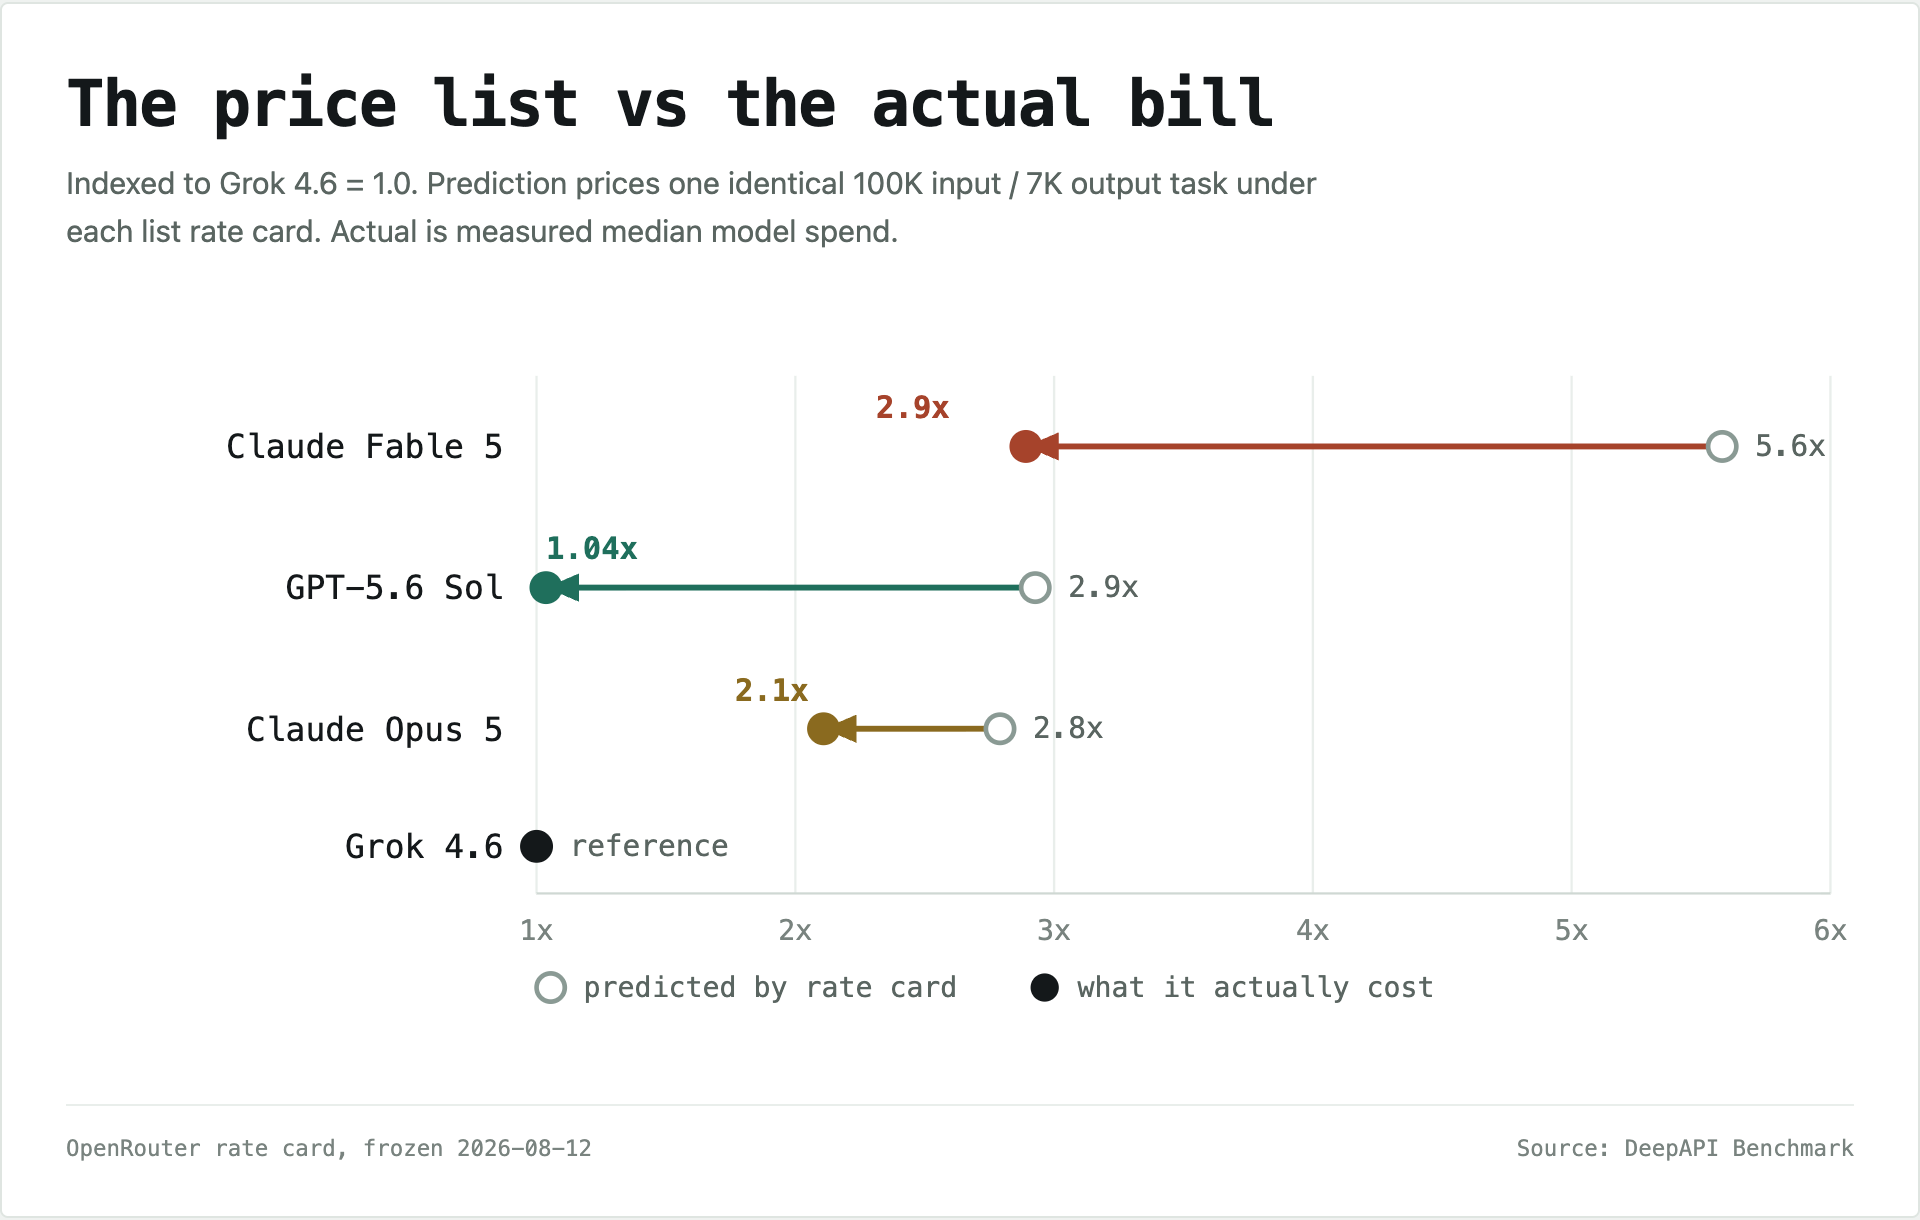
Price 1 identical 100K input, 7K output task under each rate card and you get a clean prediction of the ranking. Compare it to what the models actually spent.
| Model | Predicted vs Grok | Measured vs Grok |
|---|---|---|
| GPT-5.6 Sol | 2.9x | 1.04x |
| Claude Opus 5 | 2.8x | 2.11x |
| Claude Fable 5 | 5.6x | 2.89x |
Every gap came in smaller than predicted. Not one came in larger. This is not the rate card being wrong. It prices tokens, and it prices them correctly. These 4 models just do not use the same number of tokens to finish the same job, so the distance on the price list is always wider than the distance on the bill.
The cause is how many tokens each model spends to get the job done. Grok 4.6 spends the most of the 4, and it still ties the second most expensive model.
| Model | Reasoning tokens | Input processed | Searches | Pages read | Wall time |
|---|---|---|---|---|---|
| Grok 4.6 | 2,687 | 443,588 | 13 | 14 | 117s |
| GPT-5.6 Sol | 514 | 89,808 | 18 | 4 | 100s |
| Claude Opus 5 | 213 | 147,844 | 7 | 5 | 122s |
| Claude Fable 5 | 288 | 99,631 | 10 | 3 | 131s |
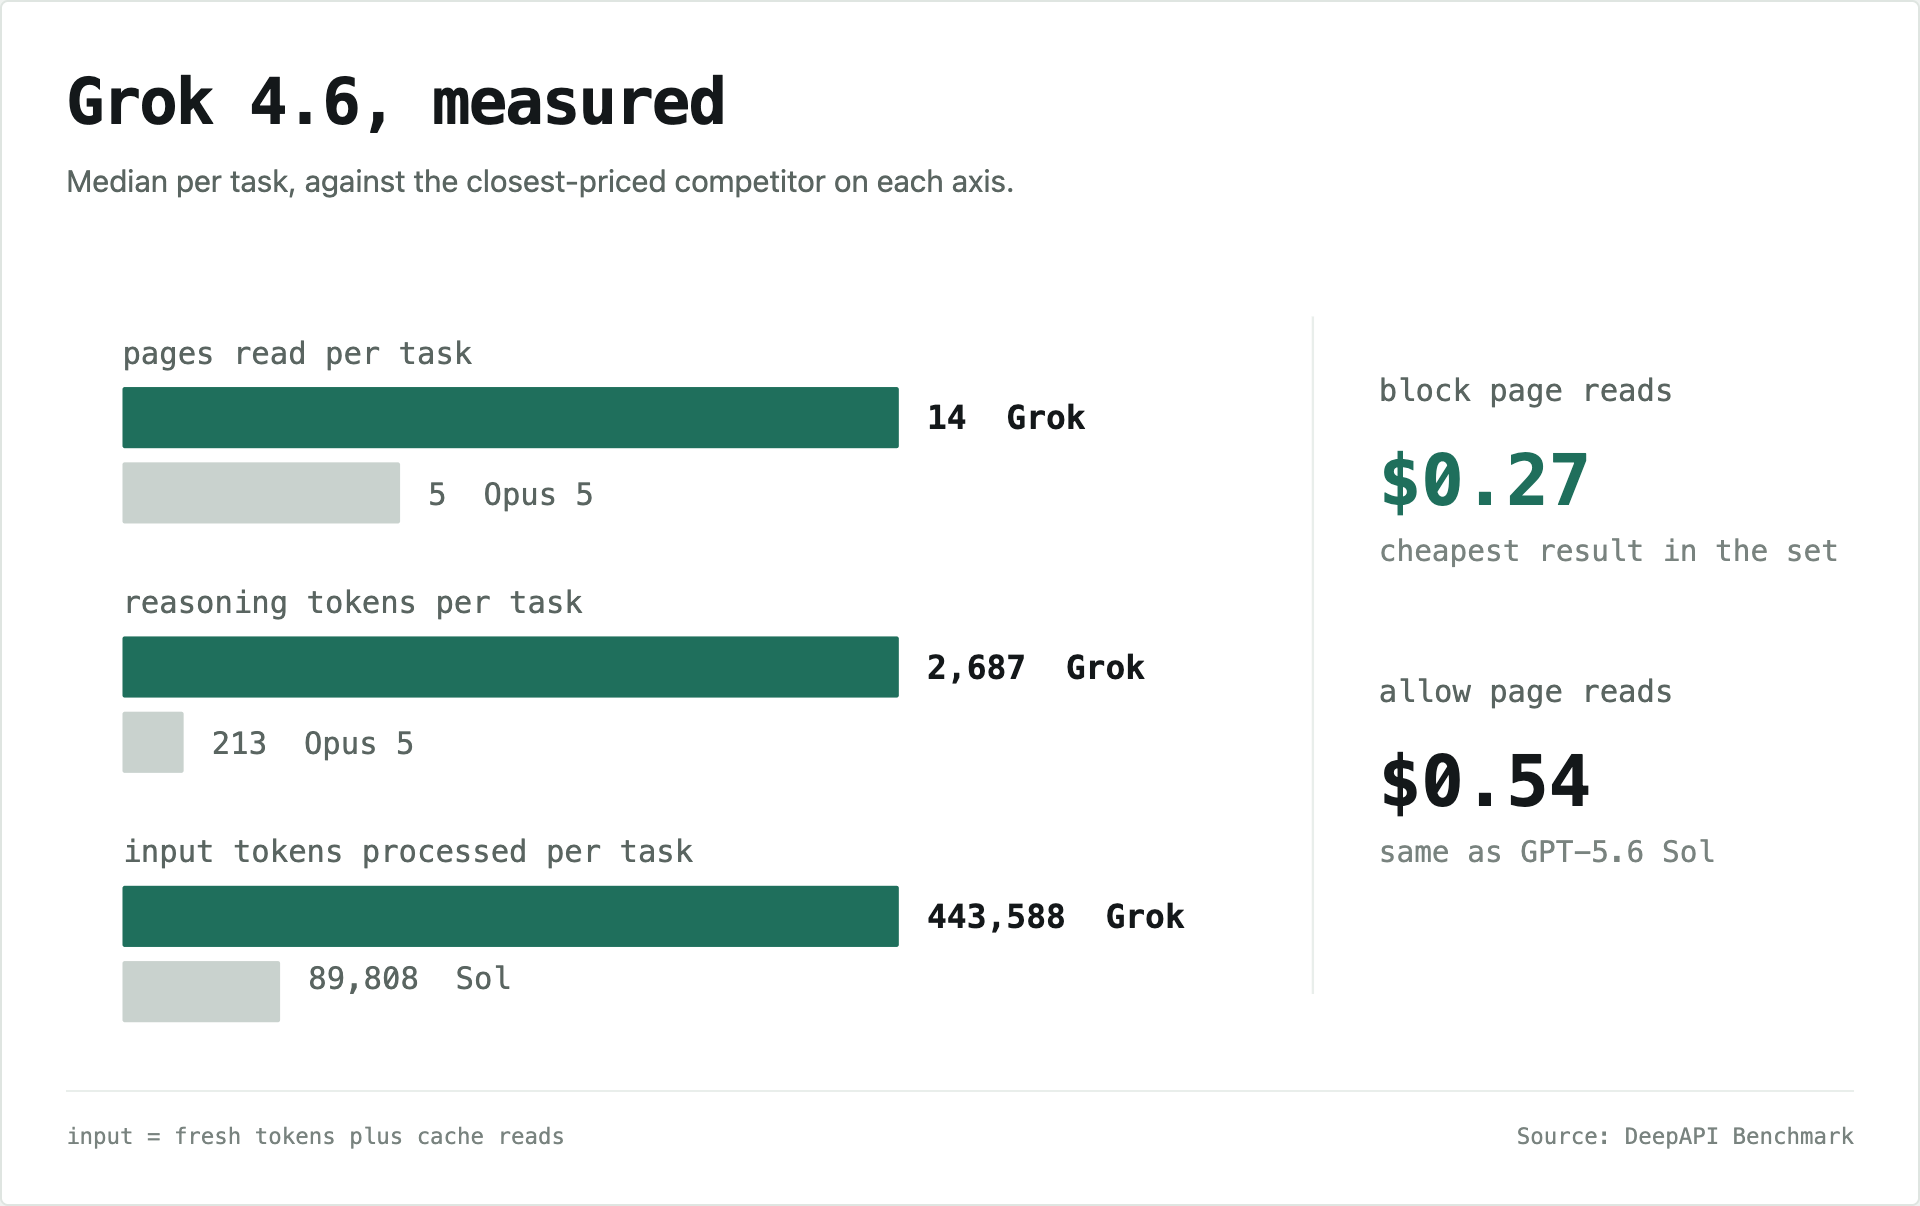
Grok did about 13x more thinking than Opus 5 and processed 4.9x more input than Sol to reach the same graded output. Cheap tokens get spent freely, and that costs about the same as expensive tokens spent sparingly.
This also settles a specific claim. On Grok 4.6's release day the framing going around was Fable 5 performance at 80 to 85% off. Our frozen rule counted that as supported only if Grok's median total came in at or below 20% of Fable's. Measured, Grok is 43% of Fable's total. The saving is real and it is roughly half.
One caution on the token numbers. Vendors count them differently, so the raw figures do not compare. When a model has already seen part of a prompt, some vendors charge that part at a lower cache rate and report it in its own column. Sol does this for nearly all of its input. It reports about 800 new tokens plus more than 89,000 cache reads. Grok reports 95,300 tokens as new. The input column above adds both together so the 4 models can be lined up at all. The dollars are the only figures that compare cleanly.
Predictability does not follow price
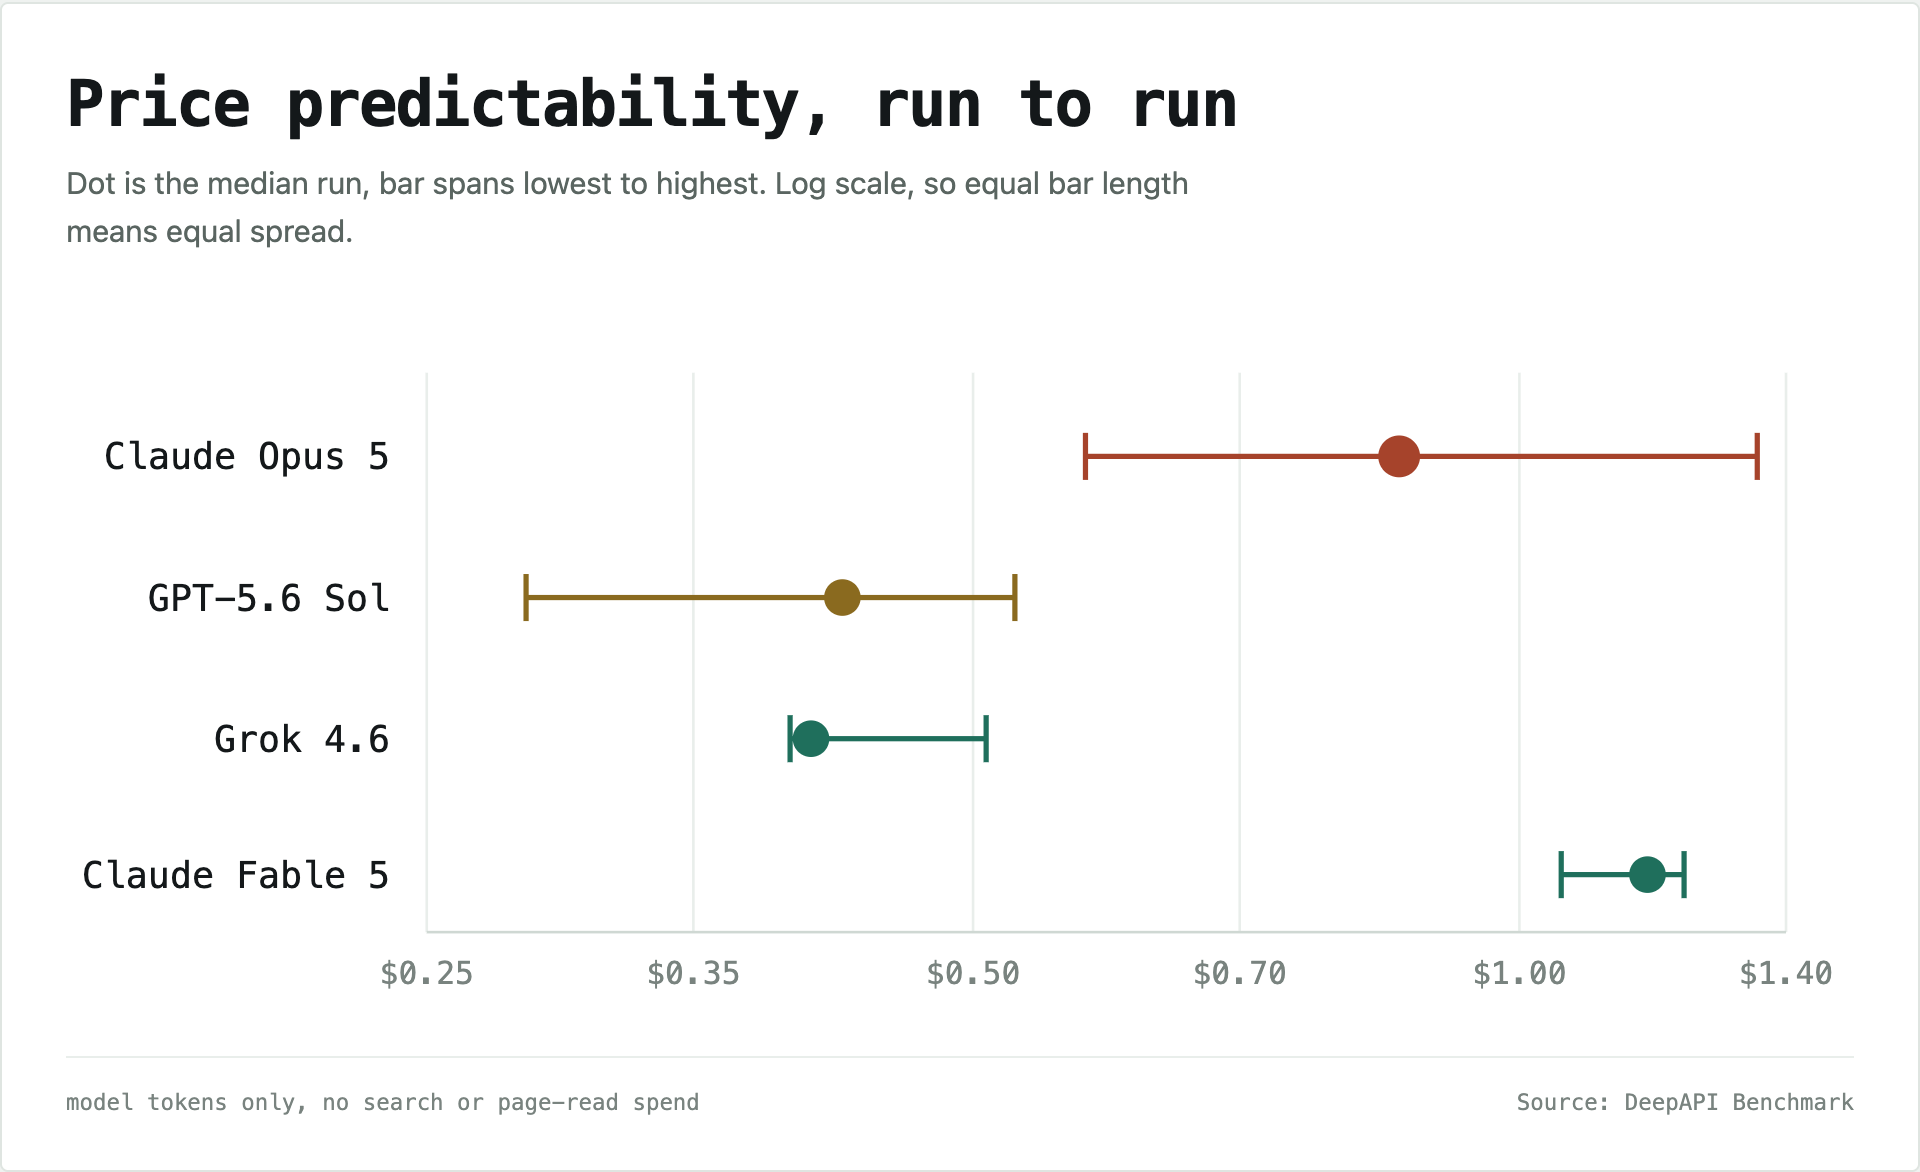
Same task, same prompt, same day. Here is what each model charged across its runs, model tokens only.
| Model | Lowest run | Median | Highest run | Spread |
|---|---|---|---|---|
| Claude Fable 5 | $1.052 | $1.175 | $1.232 | 1.17x |
| Grok 4.6 | $0.397 | $0.406 | $0.509 | 1.28x |
| GPT-5.6 Sol | $0.284 | $0.423 | $0.527 | 1.86x |
| Claude Opus 5 | $0.577 | $0.856 | $1.351 | 2.34x |
Opus 5 has the widest spread of the 4. A 2.34x swing on identical work means a per-task budget built on 1 observed run can be wrong by more than double in either direction.
Nothing about the price predicts this. Fable 5 is the most expensive model in the set and the steadiest. Opus 5 costs less and swings the most. Grok is cheap and steady, Sol is cheap and less so. Cost per task and consistency are unrelated here, and the only way to find out where a model sits is to run the task more than once.
For anything running unattended, the spread matters more than the median. A model that costs more and lands in the same place every time is easier to plan around than a cheaper one that does not.
What a model is allowed to do changes which one is cheapest
We ran Grok 4.6 and Opus 5 again with page reads forbidden, so they had to work from search results alone. They moved in opposite directions.
| Condition | Grok total | Opus 5 total |
|---|---|---|
| Search only, no page reads | $0.274 | $0.798 |
| Page reads allowed | $0.541 | $0.971 |
Grok gets cheaper the less it reads. Blocked from opening pages it cost $0.274, the lowest figure in the experiment, with fresh input falling from 95,300 tokens to 21,257. Reading pages is what makes Grok expensive.
Opus 5 went the other way. Denied page reads it searched more, and search results filled its context faster than targeted page reads did. For Opus, a few precise fetches were the efficient strategy.
Search only is cheaper and slightly worse. It produced the only unfinished run in all 30. Grok left the lead investor blank for 1 company because no search snippet named one, and declined to invent a plausible firm. That is the behaviour we want under a strict gate. It is also what never opening a page costs.
What we take from this
Per-token pricing does not predict per-task cost. It ranked the models correctly, and the distance between them was between 1.3x and 2.8x wider on the price list than on the bill. If you are choosing between 2 models on price, run your real task 5 times against each and price the runs.
Report the spread, not just the median. A 2.34x swing between runs on identical work is a planning problem that an average hides.
Decide what the agent may do before you pick the model. Search only and read allowed produced different winners here. The tool policy sits upstream of the model choice.
Count retrieval separately from tokens. They are 2 meters with different behaviour. Retrieval was 6 to 15% of the bill and barely moved between models. Search costs $0.0050 and a single page read $0.0049 on the public price list, so retrieval spend tracks how much work a model chose to do rather than which kind.
What this does not show
- Costs are computed, not billed. Token counts times a rate card frozen on 2026-08-12. Raw token counts are preserved so any rate card can be applied to the same runs.
- 1 task, 1 day. Dated fact retrieval with a fixed output schema. Nothing here carries over to long output or open ended work. Grok's 4.1K output cap was never stressed.
- Small samples. 3 replications for most arms, 5 for the original 4. Two arms landing 1.3% apart are indistinguishable, not ranked.
- The gate is lenient by design. It checks that cited pages exist and name the company, not that the funding facts are correct. Nothing here supports a claim about research quality.
- This measured cost, not capability. 29 of 30 runs cleared the bar. All 4 models could do the work.
The full experiment, including the frozen prompt, the rate card, the verifier and all 30 run transcripts, lives in our internal benchmark repository. We publish the results because the numbers surprised us and the method is cheap to repeat.
DeepBench also keeps a public leaderboard at deepapi.co/bench. That one measures something different: whether a model can complete compound multi-step missions at all, scored on missions passed rather than cost on a single fixed task.
Every model in this benchmark searched and read pages through 1 DeepAPI key. Real per-call prices, a hard USD cap on every request, and failed calls are free. Create an account.
FAQ
- What was the task?
- Find 10 companies that announced a funding round of USD 100 million or more inside a fixed 1 month window, and return strict JSON with a company, round stage, amount, lead investor, date and source URL for each. The prompt was 18 lines and went to every model as identical bytes.
- How was cost measured?
- Token counts from each run multiplied by a rate card frozen on 2026-08-12, plus the real charge for every search and page read the model chose to run, measured as a balance delta. The 2 meters are reported separately throughout.
- Was a language model used to grade the runs?
- No. Grading was a script. It checked the JSON schema, the count of 10, the amount threshold, the date window, and that at least 8 of 10 cited URLs returned HTTP 200 and contained the company name.
- Can these numbers be reproduced?
- The task, the frozen rate card, the runner, the verifier and every run transcript are preserved in our internal benchmark repository. Costs are computed from raw token counts, which are kept, so any rate card can be applied to the same runs.
Originally published at https://deepapi.co/blog/model-cost-per-task.